
Right now, somewhere, a CPG brand is in a board meeting presenting a slide that says “Amazon revenue: +42% YoY.” The room nods. Someone says “great work.” The deck moves on.
That brand is probably losing money on Amazon and doesn’t know it.
I’ve spent two decades inside CPG revenue and finance teams. The single most reliable pattern I’ve seen — across categories, across price points, across brand stages — is this: the headline marketplace number is the easiest metric to grow and the most expensive metric to optimize for. Brands that build their Amazon strategy around revenue growth end up subsidizing their own decline. They look healthy in the deck. They are sick in the P&L. And by the time the gap shows up in the cash position, the strategic options are already gone.
If you measure one thing on Amazon, it should not be revenue.

Revenue growth is the cheapest metric to manufacture
Anyone can grow Amazon revenue. Drop your price 15%. Double your ad spend. Run a Lightning Deal. Stack a Subscribe & Save discount on top of a coupon. Each move will produce a satisfying revenue chart by Friday. None of them tells you whether you actually built a better business.
Run the math on a typical scenario. A 20% revenue jump driven by a 15% promo plus a doubled ad budget can easily translate into a 40% drop in contribution profit. The chart goes up. The bank account goes down. That is not growth. That is a brand paying Amazon and Amazon shoppers to make the deck look good.
I've watched companies do this for two and three years before the cumulative damage forces a reckoning. The quarter the music stops is always uglier than anyone imagined, because the brand has by then trained itself to believe the wrong number.
The metrics that actually move the business
The brands that are quietly compounding on Amazon — and there are fewer than you’d think — track a different stack. None of these are exotic. All of them are operationally inconvenient. That’s why most teams skip them.
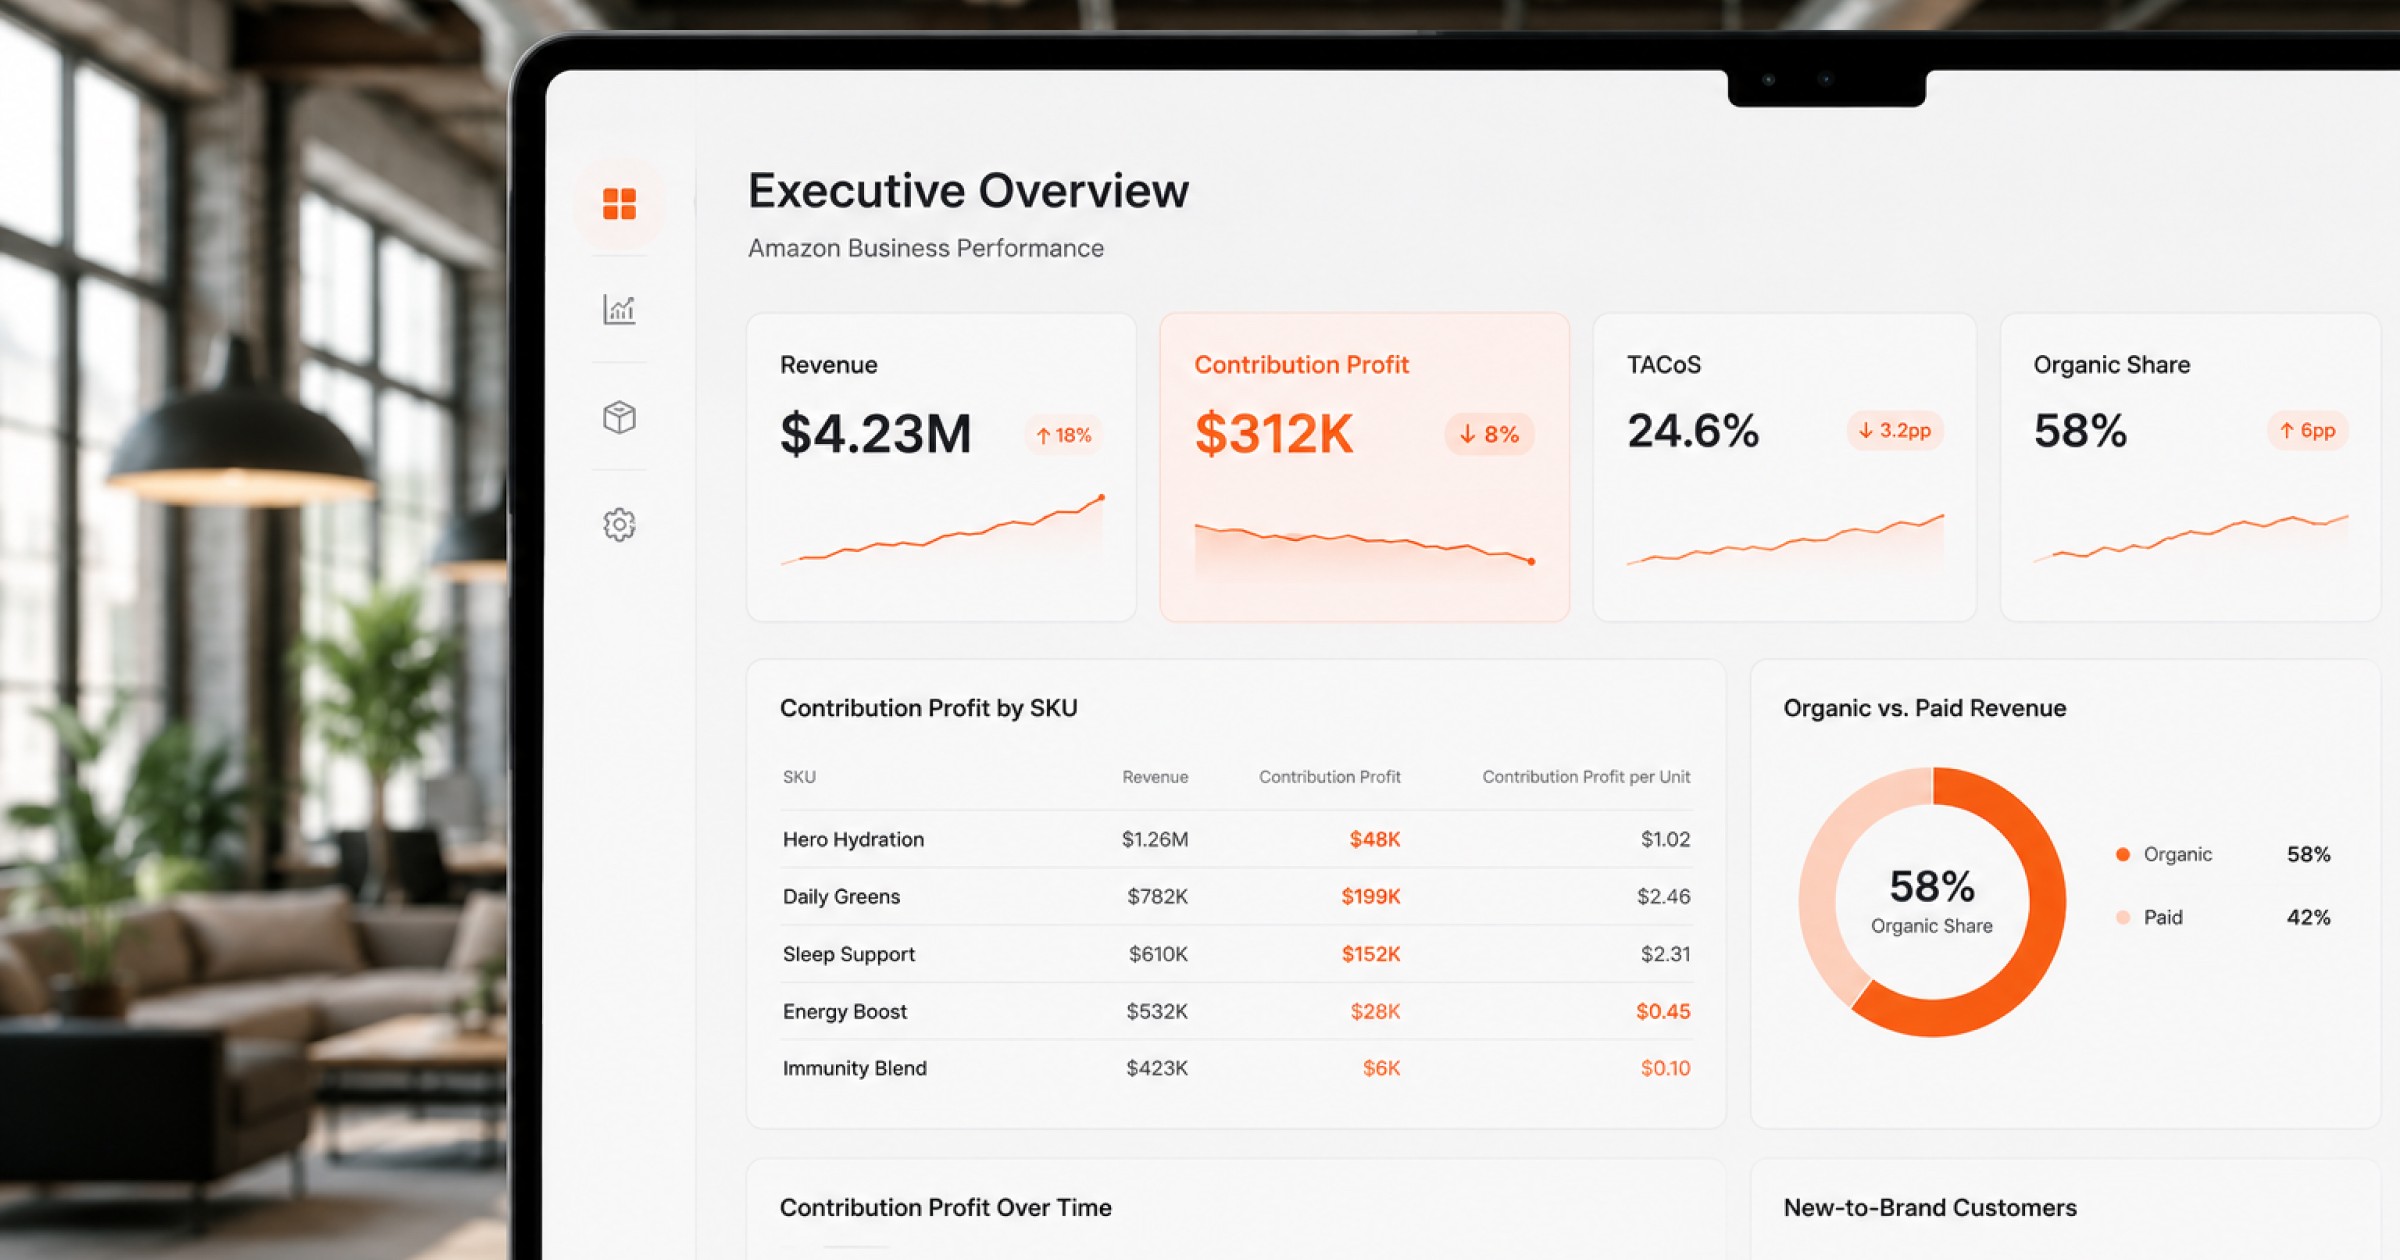
Contribution profit per SKU, post-everything. Revenue minus COGS, minus FBA fees, minus advertising, minus return reserve, minus promo discounts, minus referral fees. If your team cannot produce this number on demand at the SKU level, that is the finding. Decisions made on top-line revenue are decisions made blind.
TACoS, not ROAS. Return on ad spend tells you whether the ads were profitable. Total advertising cost of sales tells you what percentage of total revenue you spent to produce. ROAS can sit at 5x while TACoS climbs to 35%. The first looks like a win. The second is a margin disaster. Most teams report the first and ignore the second. Switch which one you optimize for, and behavior changes inside a quarter.
Organic share of revenue. What percentage of your Amazon sales would survive if you turned ads off tomorrow? If the answer is “we’d lose half,” you don’t have a brand on Amazon. You have a paid acquisition pipeline that happens to live there. That is a much weaker business than the dashboard suggests, and it puts a hard ceiling on what your Amazon presence is worth.
Incremental new-to-brand customers. Amazon will gladly sell you ad inventory targeting people who were already going to buy your product. Those clicks produce great-looking ROAS and zero incremental growth. The number that actually matters is the cost-per-incremental-new-to-brand customer. Every brand should know it. Most do not.
The pattern hiding in every CPG catalog
Pull any CPG brand’s Amazon catalog and you will find the same three SKUs.
There is a hero SKU that looks great on the revenue chart and is barely break-even on contribution profit. There is a quiet SKU doing a fifth of the volume at three times the margin, sitting in nobody’s strategy deck. And there is a third SKU that’s losing money on every unit, propped up by ad spend the team is afraid to cut because “it’s our hero.”
The brand makes inventory, marketing, and NPD decisions based on the revenue chart. Those decisions reinforce the wrong SKUs and starve the right ones. Two years later the team is wondering why the business “feels harder,” even though the revenue line is up and to the right.
This is the closest thing to a universal pattern in marketplace P&Ls. It is fixable in roughly ninety days. It rarely gets fixed because the dashboard everyone looks at hides it.
A test for your team this week
Pull your top ten Amazon SKUs by revenue. For each one, two questions:
What is the contribution profit per unit, after fees, ads, and returns?
If we lost the buy box for thirty days, how much of that revenue actually disappears?
Your team should be able to answer both inside twenty-four hours. If they can’t, you’ve just diagnosed your real problem. The number you’ve been celebrating in the board deck has been disconnected from the number that pays for the company.
The Takeaway
Revenue growth on Amazon is a metric. It is not the metric. The brands that win the next decade of marketplace growth will be the ones that stop optimizing the chart that looks best in the deck and start optimizing the chart that pays for the business.
Revenue is vanity. Margin is sanity. Cash flow is reality. On Amazon, those three numbers can move in three different directions for years before anyone in the boardroom notices — and then they collapse together in a single quarter.
Measure the right thing now, or measure the wrong thing later, when the answer is no longer something you can change.


