

“We spent $12,000 on A+ Content last year and I have no idea if it worked.” A director of eCommerce at a protein bar brand told me that on our first call. She’d hired a creative agency to build premium A+ modules for their top 30 SKUs. The designs were beautiful. The conversion data was inconclusive. She didn’t know whether to invest more or walk away.
I hear this constantly. A+ Content sits in a frustrating gap — everyone agrees it matters, nobody agrees on how much, and the brands investing the most often have the least clarity on ROI.
After working directly with dozens of CPG brands on Amazon at Neato, here’s what I know: A+ Content does move conversion rates, but only when it’s built around how CPG shoppers actually make purchase decisions — not around what looks good in a design portfolio.
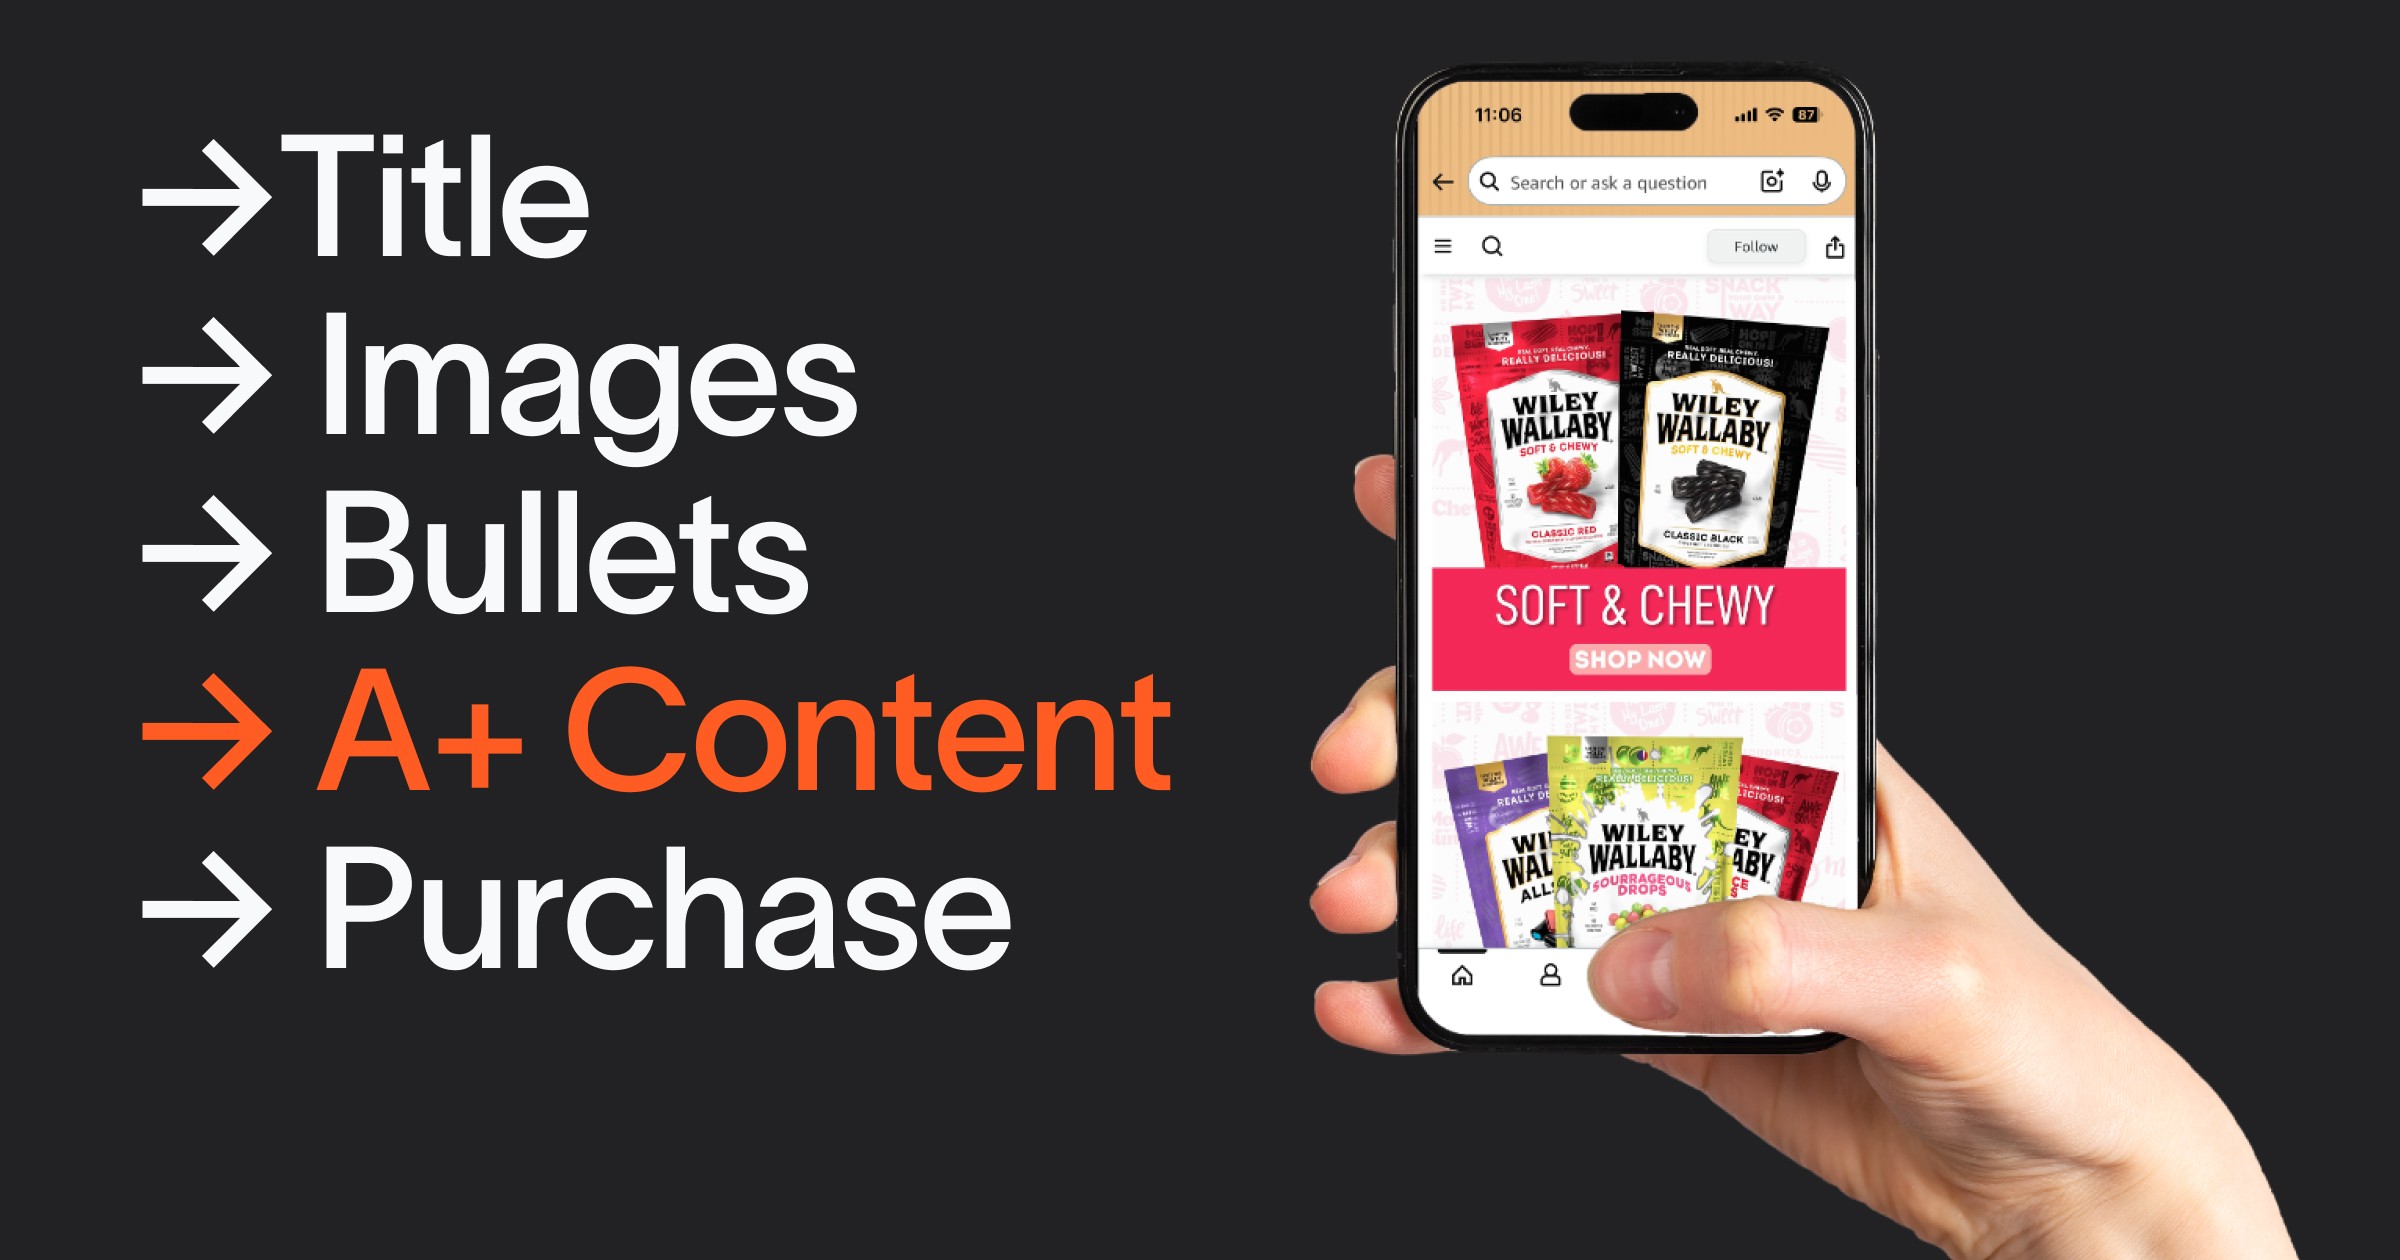
A+ Content (formerly Enhanced Brand Content) replaces the standard text product description with rich media — images, comparison charts, text overlays, brand storytelling modules. It appears below the bullet points, above the reviews.
For CPG brands, it serves three functions:
Objection resolution. The shopper found your listing, read the title and bullets, and is 70% toward a purchase decision. A+ Content handles the remaining 30% — ingredients concerns, usage questions, flavor comparisons, size clarification.
Brand differentiation. In CPG categories where multiple products look identical in search results, A+ Content communicates why your product is different. Not better — everyone claims better. Different.
Cross-sell and catalog browsing. Comparison tables and brand story modules drive shoppers to explore your other products. For CPG brands with product lines (multiple flavors, sizes, variants), this is real money.
Amazon’s own data suggests A+ Content lifts conversion 5–10% on average. At Neato, we see a wider range: poor A+ Content adds 2–3%, while well-executed, category-specific A+ Content lifts 10–15% on competitive listings.
The CPG-Specific Playbook
Module Selection: What Works in CPG
Module | CPG Use Case | Priority |
|---|---|---|
Standard Comparison Chart | Flavor/variant comparison across your line | Must-have |
Standard Image & Text | Ingredient callouts, usage instructions | Must-have |
Standard Four Image & Text | Product benefits with visuals | High |
Standard Single Image & Sidebar | Certifications, sourcing story | Medium |
Standard Image Header | Brand banner/lifestyle hero | Medium |
Standard Tech Specs | Nutritional info formatted visually | High for food/bev |
The comparison chart is the single most impactful module for CPG brands with multiple variants. When a shopper lands on "Original Flavor," a chart showing all six flavors with key differentiators does two things: confirms their choice and introduces products they might add to cart.
One of our partners at Neato — a licorice brand with eight flavors — saw a 22% increase in multi-unit orders after we implemented comparison charts across their top ASINs. Shoppers who came for one flavor left with two or three.
Answer the Questions Shoppers Actually Ask
Every CPG category has specific purchase anxiety questions. Your A+ Content should answer them visually:
Food & Beverage: Ingredients (clean label visualization), taste (flavor descriptors, not just "delicious"), serving size and count (prevent "smaller than expected" returns), sourcing/origin, dietary compatibility (gluten-free, vegan, keto).
Pet Products: Safety for specific pets (age, size, breed), active ingredients with evidence, dosage or feeding guide, comparison to current alternatives.
Personal Care: Ingredient transparency, who it's for (skin type, hair type), routine integration, expected results and timeline.
The Mobile-First Mandate
Over 70% of Amazon shopping happens on mobile. Most A+ Content is designed on a 27-inch monitor. The result: gorgeous desktop layouts that become unreadable walls of tiny text on a phone.
Rules:
Large text in images. Readable at 375px width without zooming. Test on your actual phone.
One idea per module. Don't cram three benefit callouts into a single image.
Comparison charts with 4 or fewer columns. Five columns look fine on desktop; on mobile, they're a scrollable mess.
Vertical image orientation. Square or portrait images fill mobile screens better than landscape.
Premium A+ Content
Amazon offers Premium A+ Content (video, interactive hotspots, full-width imagery) at no additional cost to Brand Registry-enrolled brands that have published Brand Stories and have active A+ on all ASINs.
For CPG, the most valuable Premium module is video. A 30-second product video shows what static images can't: food texture, soap lather, a pet's reaction to a treat. Our data shows Premium A+ with video outperforms standard A+ by 8–12% in conversion rate on CPG listings.
Mistakes That Kill Conversion
Brand story before product information. Shoppers scrolling past your bullets want product details, not your founder's journey. Lead with product-specific content. Brand story goes at the bottom.
Stock photography. CPG shoppers can tell. Use real product photography — in-context lifestyle shots of your actual product. The cost difference is minimal compared to the credibility gap.
Ignoring the listing as a system. A+ Content works with your main images, title, bullets, and reviews to form a complete purchase argument. If your A+ repeats what bullets already say, it's wasted space. Map your persuasion arc: title handles discovery, images handle visual persuasion, bullets handle key benefits, A+ handles deeper consideration and cross-sell.
Never updating. A+ Content isn't set-and-forget. Seasonal updates, new product additions to comparison charts, refreshed lifestyle photography — these keep content performing. At Neato, we review and update A+ Content quarterly for our brand partners.
Measuring Impact
A+ Content doesn't have its own analytics dashboard. Measuring impact requires inference:
Establish a baseline. Record your listing's conversion rate (Unit Session Percentage) for 30–60 days before launch.
Launch and wait. Give it 30 days. Don't change pricing, advertising, or other listing elements — isolate the variable.
Compare. Measure conversion rate change. Control for seasonality with year-over-year comparison if possible.
A/B test with Manage Your Experiments. Amazon's built-in A/B testing tool is the gold standard. Test one variable at a time: different comparison chart, different hero image, product-first vs. brand-first.
Action Plan
Audit your top 10 ASINs. Pull each listing up on your phone. Can you read the A+ Content without zooming? Does it answer category-specific questions? Does it include a comparison chart?
Prioritize by impact. Start with highest-traffic ASINs. A 10% conversion lift on 5,000 sessions/month is worth far more than the same lift on 200 sessions.
Build comparison charts for every product family. Multiple flavors, sizes, or variants? Comparison charts should be on every listing. Highest-ROI module in CPG.
Run quarterly A/B tests. Continuous optimization beats a one-time design project every time.
Align A+ with your advertising strategy. If Sponsored Products ads drive traffic to a listing, that listing’s A+ Content is part of your conversion funnel. Ad copy promises need to be fulfilled by what the shopper sees. (Learn how Neato integrates content and advertising →)
Tom Abrams is VP of Revenue at Neato, where he leads brand partnerships and revenue growth for CPG brands on Amazon. Neato is a 2P eCommerce acceleration partner — we buy inventory, become seller of record, and grow brands on Amazon with certainty.


