

The TikTok Shop pitch sounds great in the revenue meeting. $180K in GMV last month. 42% month-over-month growth. The channel is scaling. Then finance runs the actuals and finds $31,000 in returns that nobody provisioned for. The 35% gross margin the brand modeled is actually 22%. The channel that looked like a growth engine is running at break-even — or worse.
This is the return-rate reality of TikTok Shop in 2026. And almost nobody in CPG is modeling it correctly.
TikTok Shop return rates for CPG brands are running 12-20% in 2026 — roughly 3-5x the return rates most brands experience on Amazon. The gap is structural, not accidental: TikTok Shop's impulse-purchase model, driven by live shopping and short-form video discovery, generates higher buyer's remorse than Amazon's search-driven purchase model. Brands that don't provision 15-20% for returns in their TikTok Shop P&L are calculating contribution margin on false numbers.
This is the return provisioning model that CPG brands need before they scale TikTok Shop spend — and the category-level data that makes the math real.
Why are TikTok Shop return rates so much higher than Amazon?
The difference isn't platform policy. It's purchase psychology.
On Amazon, a customer searches for "organic dog treats grain free," reads three listings, compares prices, checks reviews, and buys. The purchase is intentional. The customer knew what they wanted before they found the product. Amazon CPG return rates run 3-5% for most categories because the buyer made a deliberate decision.
On TikTok Shop, a customer is watching a creator's video about morning routines, sees a skincare product demo, taps "buy now" during the video, and has the product in their cart before they've finished the content. The purchase is impulsive. The customer didn't know the product existed 30 seconds ago.
That difference in purchase intent drives everything:
Discovery-driven vs. search-driven. TikTok Shop purchases are triggered by content, not by need. The buyer didn't wake up planning to buy that serum. They saw it, liked the creator, and bought it in a dopamine window. When the product arrives 4-7 days later, the dopamine is gone. Return.
Live shopping amplification. TikTok Shop live sessions create urgency — countdown timers, limited-quantity drops, creator pressure. Conversion rates during live sessions run 2-4x higher than static TikTok Shop listings, but return rates on live purchases also run 20-30% higher. The urgency that drives the sale also drives the return.
Expectation mismatch. Video content creates product expectations that physical delivery doesn't always match. The color looks different. The size is smaller than it appeared on screen. The texture isn't what the video suggested. This is especially acute in beauty and skincare, where 60-second video demos can create expectations that no product consistently meets.
TikTok's buyer-friendly return policy. TikTok Shop's default return window is 15 days for most categories, with free return shipping on many items. The friction to return is lower than on Amazon, where return rates are partially constrained by the effort required. TikTok has made returning nearly as easy as buying.
What are actual return rates by CPG category?
The averages mask significant category variation. Here's what we're seeing across CPG verticals on TikTok Shop in 2026:
Category | TikTok Shop Return Rate | Amazon Return Rate | Multiple |
|---|---|---|---|
Beauty/Skincare | 18-25% | 5-8% | 3-4x |
Supplements/Wellness | 15-22% | 4-7% | 3-4x |
Pet Products | 10-15% | 3-5% | 3x |
Grocery/Pantry | 5-10% | 2-4% | 2-3x |
Household | 12-18% | 4-6% | 3x |
Beauty and skincare are the worst performers on returns — which is painful because they're also the highest-volume CPG category on TikTok Shop. The visual-first discovery model that makes beauty products sell well on TikTok is the same model that creates the expectation gap driving returns.
Grocery and pantry have the lowest return rates because the purchase decision is simpler (you know what peanut butter tastes like), the price point is lower (not worth the effort to return), and the product is often consumed before the return window closes.
Pet products sit in the middle. Pet parents are willing to try new products they discover on TikTok, but if the dog doesn't eat the treat or the cat ignores the toy, it's coming back.
How should you model TikTok Shop returns in your P&L?
Most brands build their TikTok Shop P&L like this:
Revenue - COGS - Platform Fees - Advertising = Contribution Margin.
That model is incomplete. It's the model that produces the false 35% margin that turns into 22% when finance reconciles. The correct model is:
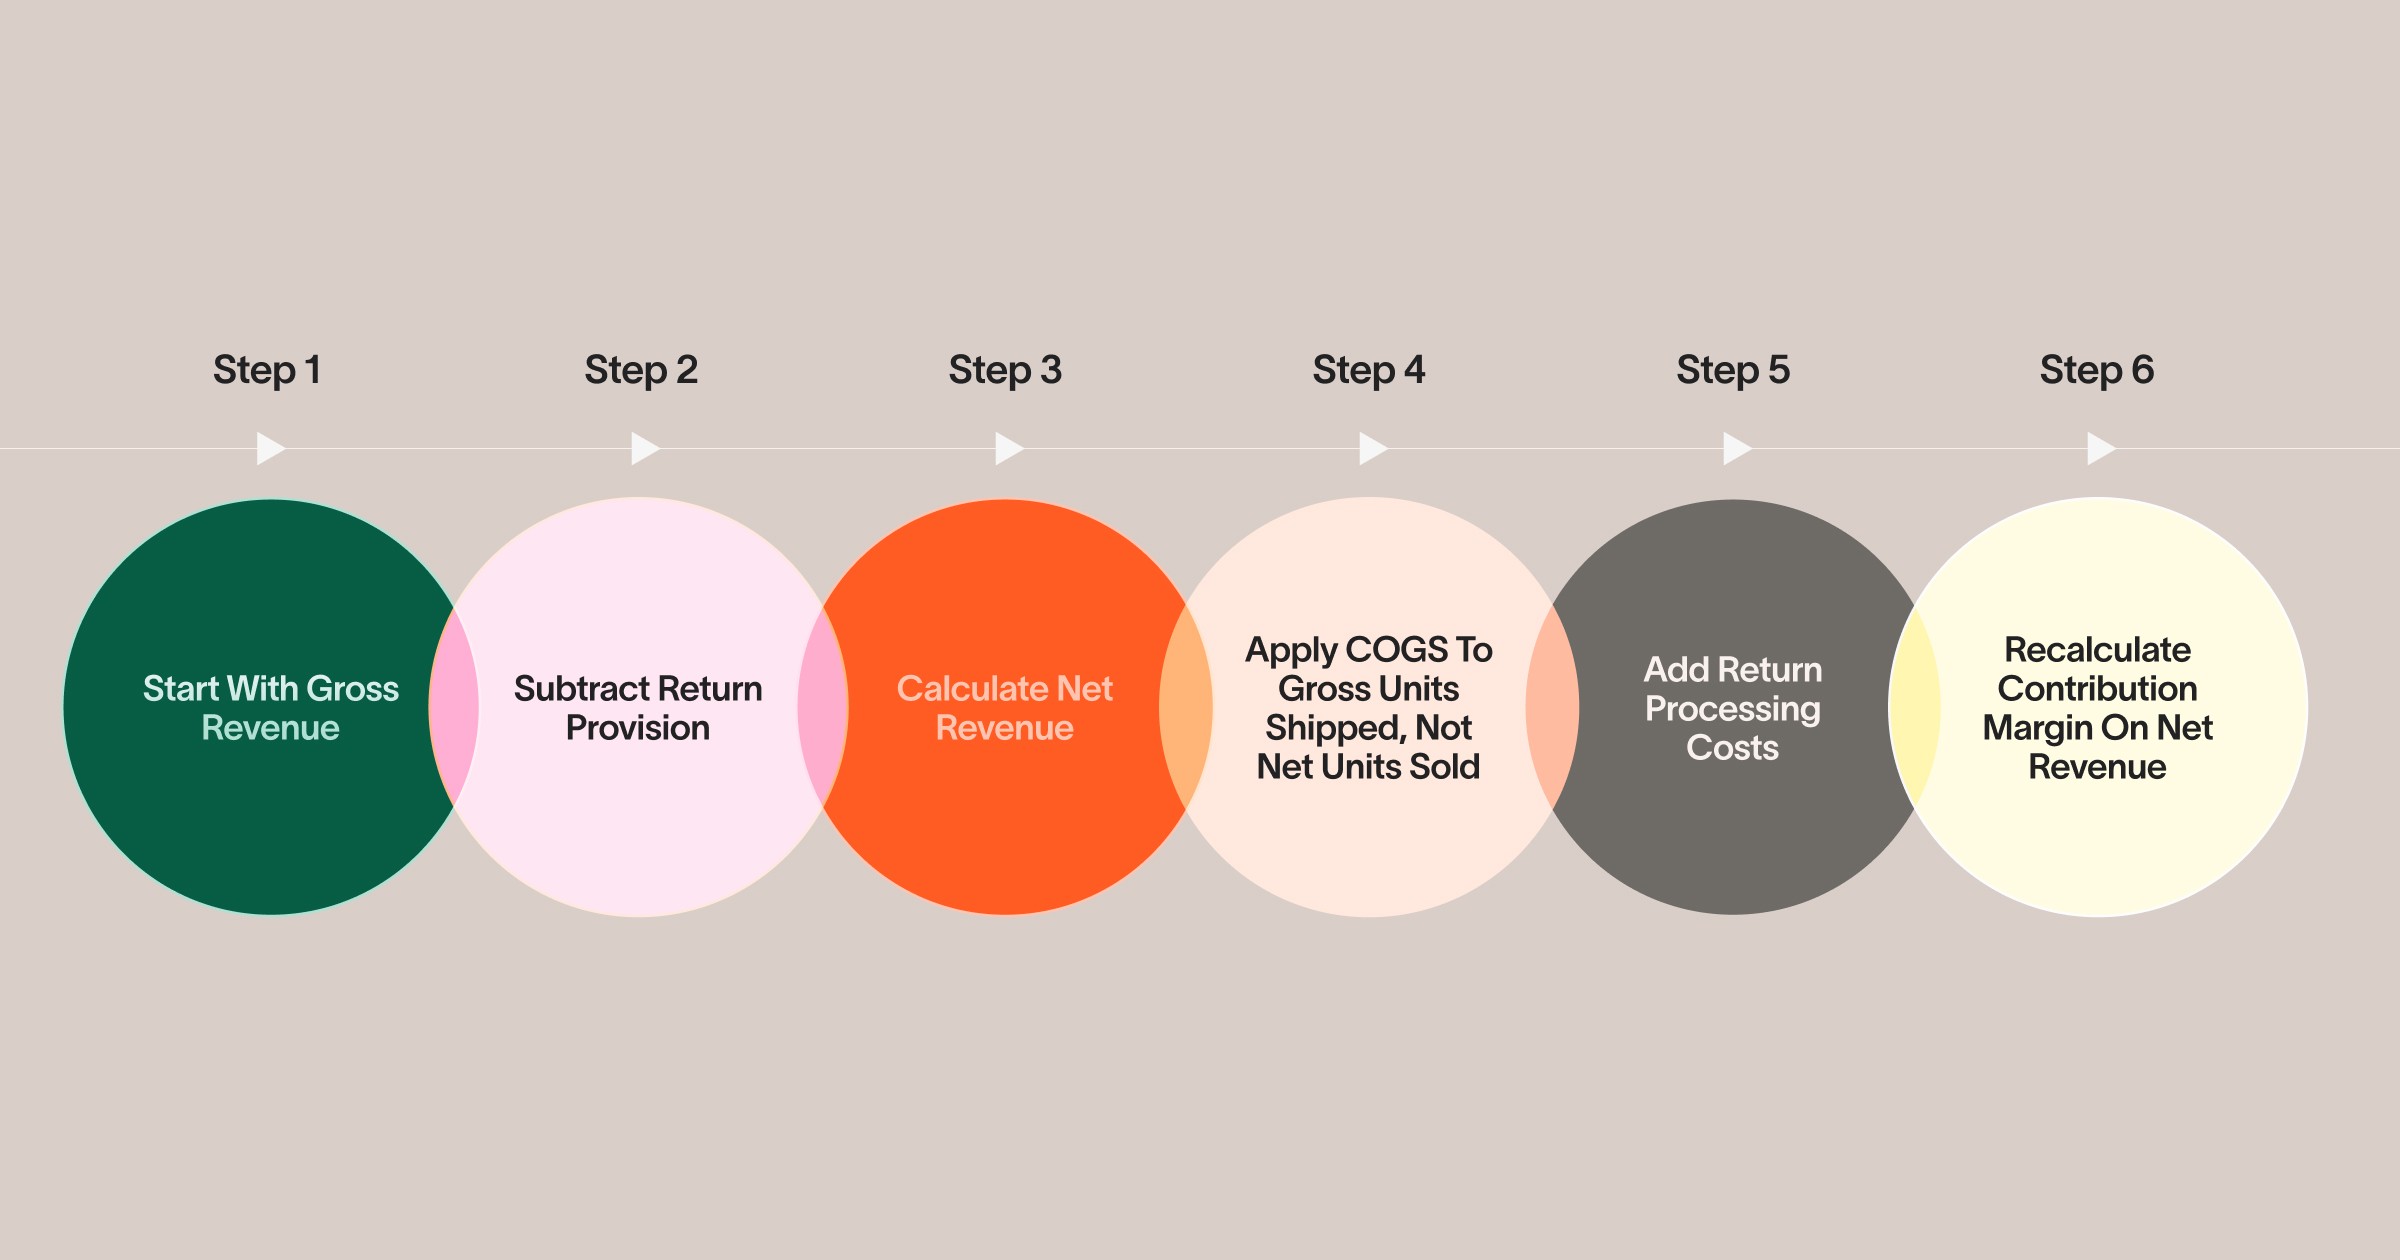
The TikTok Shop Return Provisioning Model
Step 1: Start with gross revenue. This is the total GMV TikTok Shop reports.
Step 2: Subtract return provision. Apply your category-specific return rate to gross revenue. If you don't have 90 days of TikTok Shop data, use the category benchmarks above. For beauty, provision 20%. For grocery, provision 8%. For everything else, provision 15% until your own data says otherwise.
Step 3: Calculate net revenue. Gross revenue minus return provision = net revenue. This is the number your P&L should be built on.
Step 4: Apply COGS to gross units shipped, not net units sold. You're paying to produce and ship every unit, including the ones that come back. Returned units in CPG are rarely resellable — opened supplements, used skincare, pet food with broken seals. Your COGS line should reflect total units shipped.
Step 5: Add return processing costs. Inbound return shipping ($3-5 per unit for standard CPG), inspection/disposition ($1-2 per unit), and destruction or liquidation of unsellable returns. For most CPG products, return processing costs $4-7 per unit.
Step 6: Recalculate contribution margin on net revenue.
Here's the math for a beauty brand selling on TikTok Shop:
Line Item | False Model | Correct Model |
|---|---|---|
Gross Revenue | $100,000 | $100,000 |
Return Provision (20%) | — | -$20,000 |
Net Revenue | $100,000 | $80,000 |
COGS (on all units shipped) | -$35,000 | -$35,000 |
Return Processing (20% × $5) | — | -$3,400 |
Platform Fees (5% of gross) | -$5,000 | -$5,000 |
Advertising (15% of gross) | -$15,000 | -$15,000 |
Contribution Margin | $45,000 (45%) | $21,600 (27% of net) |
The false model shows 45% contribution margin. The correct model shows 27%. That 18-point gap is the return reality gap — and it's the gap that kills TikTok Shop unit economics for brands that don't provision correctly.
Does TikTok cover any of the return cost?
Partially — and the terms keep shifting.
As of mid-2026, TikTok Shop offers return shipping subsidies on select categories and during promotional periods. These subsidies typically cover 50-70% of return shipping costs for products under $20, and 30-50% for products above $20. But they're not guaranteed, not permanent, and not applied uniformly.
TikTok also absorbs the platform fee on returned transactions — the 5% commission is refunded to the seller when a return is processed. This is meaningful but doesn't offset the COGS, shipping, and processing costs of the return.
The net effect: TikTok's return subsidies reduce the brand's per-return cost by roughly $1.50-$3.00 per unit, depending on product price and category. That helps, but it doesn't close the gap. A beauty brand with a 20% return rate and $5 average return processing cost might see that cost drop to $3 with TikTok subsidies. The contribution margin impact is still 15+ percentage points below the false model.
Don't build your P&L around TikTok's return subsidies. They're a promotional tool that TikTok can adjust or remove at any time. Build your model on the assumption that you're bearing the full return cost, and treat any subsidy as upside.
How do you reduce TikTok Shop return rates?
You won't eliminate the structural gap — TikTok Shop will always have higher returns than Amazon because of the purchase model. But you can manage it down.
Set expectations in the content. Show the actual product, not a filtered version. Include dimensions, texture close-ups, and usage demonstrations that match real-world experience. Creators who oversell generate higher conversion rates and higher return rates. The net effect is often negative.
Target repeat-purchase categories. Consumable CPG products — supplements, snacks, pet food — have structurally lower return rates because the product gets consumed. Durable goods and beauty tools have higher return rates because the product sits around long enough for buyer's remorse to set in.
Price for the return reality. If your category runs 18% returns on TikTok Shop, your pricing needs to reflect that. A product priced for 5% returns on Amazon can't sustain the same price on TikTok Shop unless you're willing to accept the margin compression.
Control creator selection. Creators who drive the lowest return rates are the ones whose audiences actually want the product — niche creators with engaged, category-specific followings. Mega-influencers with broad audiences drive volume and returns in equal measure.
The Neato point of view
TikTok Shop is a real channel for CPG in 2026. The volume is real. The growth is real. But the margins are only real if you model returns correctly.
Neato operates TikTok Shop for our partner brands as part of our omnichannel 2P model — all fulfilled from a single Amazon-integrated inventory pool via MCF. We provision for returns at the category-specific rates in this piece, and we build those provisions into the wholesale economics before the first unit ships. When brands ask us whether TikTok Shop "works," the answer is: it works when the P&L reflects what actually happens after the sale. The Return Provisioning Model isn't a pessimistic exercise — it's the difference between a channel that scales and a channel that looks like it scales while quietly eroding margin.


